At this point, it’s common knowledge that analytics and big data are the key to modern-day business success. However, the process of finding the most valuable insights is far from a black and white task.
Consumers today rely heavily on the internet to find what they need. That being said, a company website is the central hub for how people discover and interact with businesses of all shapes and sizes.
Using big data to influence your website’s development requires a very close attention to detail and knack for reading between the lines. With over 2.5 quintillion bytes of data being produced every day and customer mindsets shifting by the hour, it’s incredibly easy to get overwhelmed. The general objective is to grow in accordance with what people prefer.
Luckily, businesses no longer need a crystal ball to visualize this progression. Google Analytics Behavior Section does wonders to eliminate the guesswork and reveal what the bulk of your visitors’ desire in relation to your platform.
What is the use of the Behavior Section in Google Analytics?
Analyzing how people engage with your website will not just help you in optimizing your content, but also to understand the interests of your audience and how they are interacting with different pages.
Seeing how visitors navigate and flow through your website gives you a firm understanding of the thought processes at work and how you can influence them to go down the paths that relate to your objectives.
The data you receive from the Behavior Section can be the deciding factor for how you optimize your entire interface. For example, you can add, remove, or re-arrange CTA buttons based on how people are interacting with them, make educated decisions on how to re-organize your linking strategy, optimize your site’s visual hierarchy, and much, much more.
Additionally, there are many external factors that come into play here. For instance, digital PR and marketing firms generally monitor things like social media engagement, backlinks, search engine rankings, and a plethora of other online activities of their clientele to look for patterns and how they can apply them to their strategy.
The greatest part about the Google Analytics Behavior Section is if used correctly, it can significantly influence any type of online venture for the better. Regardless of your goals or level of expertise, here is an intuitive guide to use this data section and bring your website engagement to the next level.
White Label GA4 and GTM Services for Digital Agencies
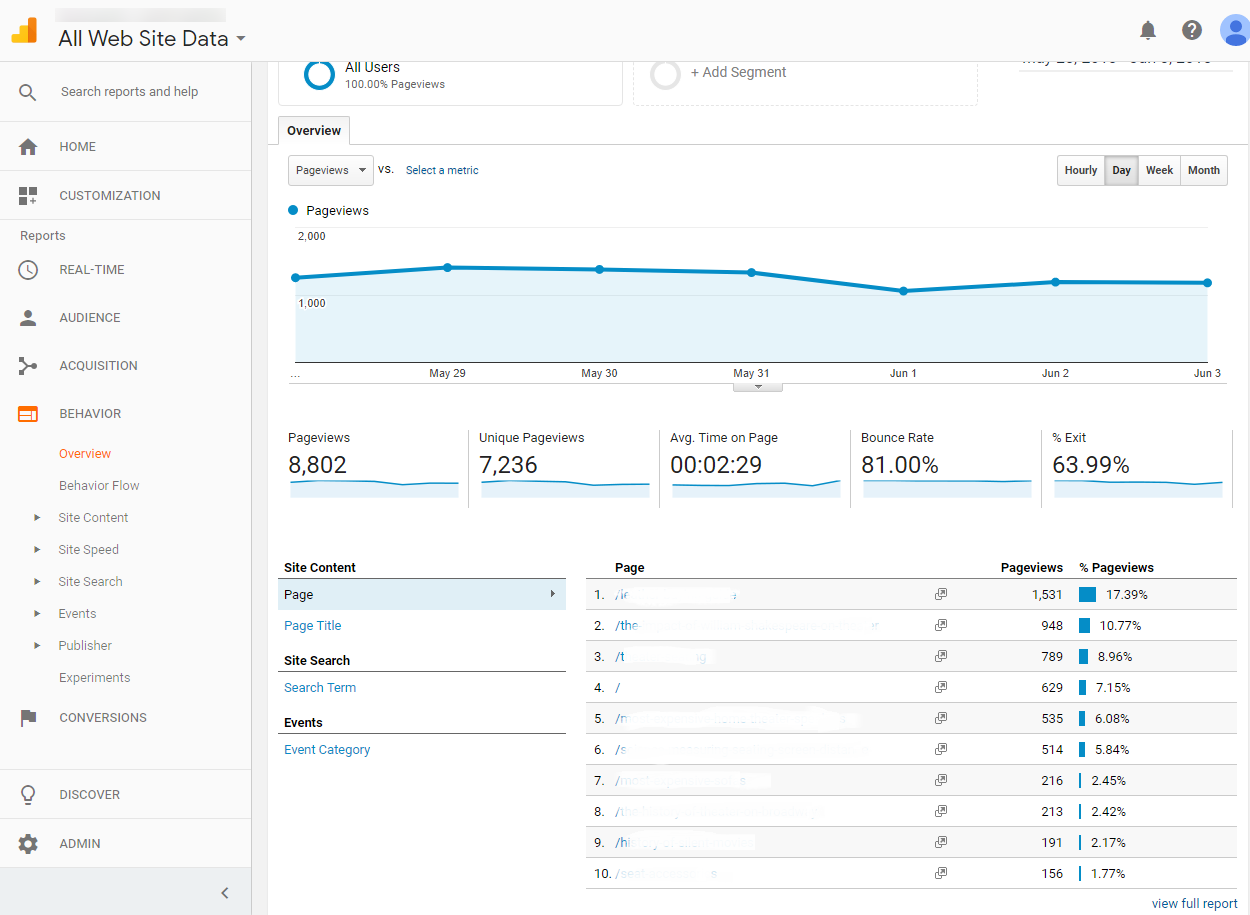
Overview
Although the general task of the Behavior Section in Google Analytics is to monitor your URLs and how people interact with them, there are many facets that come into play over a specified timeframe.
The yielded metrics can mean many different things to different business types. For instance, if you are a service provider and are seeing a lot of views on the pages where you describe an offer with additional information, this is typically a sign that bodes well for lead generation. If the traffic is heavy on different areas of the website, you can add certain cues, CTAs, details, and more to those pages to bring attention to the information that was created to educate the audience.
If you sell products on an e-commerce website, the pages with the highest percentage of views are generally the most popular products in your catalog, obviously. Therefore, using this behavioral data, it might be a wise move to promote deals on those particular pages to encourage more conversions.
The list of scenarios goes on and on. Essentially, the Behavioral Section is all about gauging actions and pinpointing the most effective reaction.
Here are the key terms and definitions to familiarize yourself with throughout this process.
Definitions
- Page: The page is represented by the URL.
- Pageviews: Pageviews are the total number of times your pages are viewed. Repeated views of a single page are included.
- %Pageviews: This refers to the percentage of the audience that viewed a particular page against the total amount of views across your entire website.
- Unique Pageviews: Unique Pageviews are the number of sessions during which a specified page was viewed at least once. A unique pageview is counted for each page URL + page title combination.
- Bounce Rate: The percentage of single-page sessions in which the visitor left the page without any interaction.
- %Exit: %Exit is the percentage (number of exits) / (number of pageviews) for a page or set of pages.
Behavior Flow
The Behavior Flow of a website can be a dense (and sometimes confusing) report. The reason being that it compiles and mashes information from a wide range of data set across your platform.
Primarily, it shows you how many people visit your website, the path of where and how they navigate through your pages, and which ones they are on when they leave.
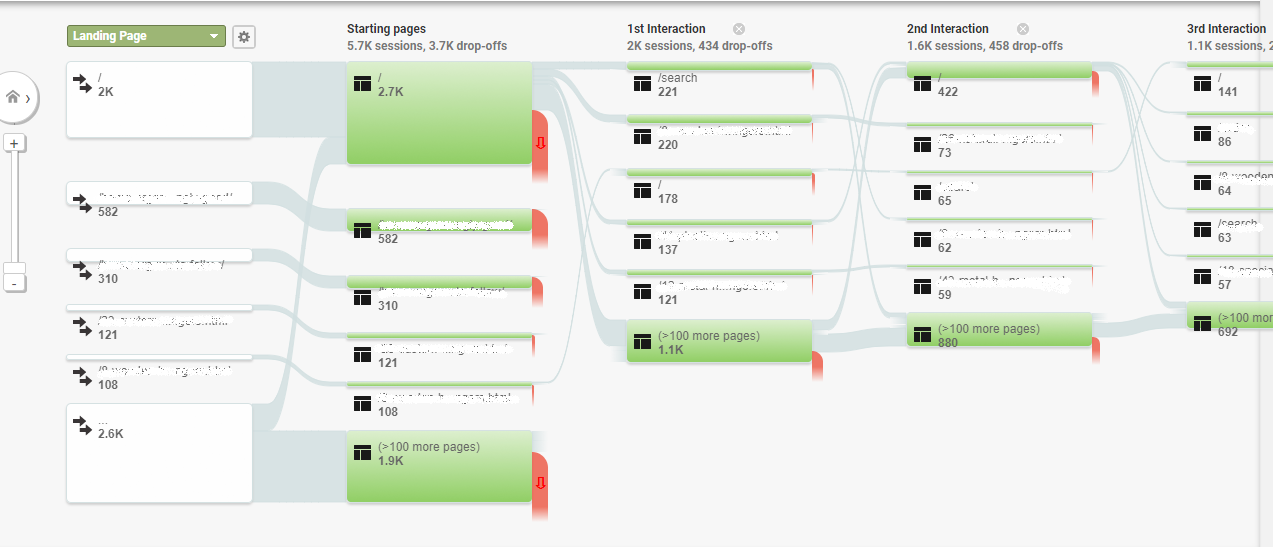
One of the most valuable insights this information reveals is the most popular pathways visitors take through your website. When most people enter a website, they will likely visit other pages before leaving. Knowing the patterns that pertain to this is influential in how you prioritize certain changes to your site’s content. Let’s say you only have a few minutes to work on your website. Using your knowledge from the Behavior Flow report, you might want to spend that time fine tuning the pages that have been receiving the most traffic, or the opposite.
The overview section in Google Analytics will show you how much traffic your site is getting. The Behavior Flow helps you understand the deeper meaning for how people engage with it.
Suppose you are getting X% of traffic on a service page. The Behavior Flow shows you the path from where it is all coming from. If there is no indirect traffic from other pages of your website, a wise move would be to provide a backlink to the services page on the more popular pages on your website, then check in on the flow later to see if the traffic has spiked as a result.
E-commerce Behavior Flows can help in learning how certain shopping patterns equate to your platform. If more customers are starting on a product page, and you see a pattern in user navigation to another particular item, you can display that product on the original page. This is a fantastic way to upsell. Amazon does this on many of their listings.
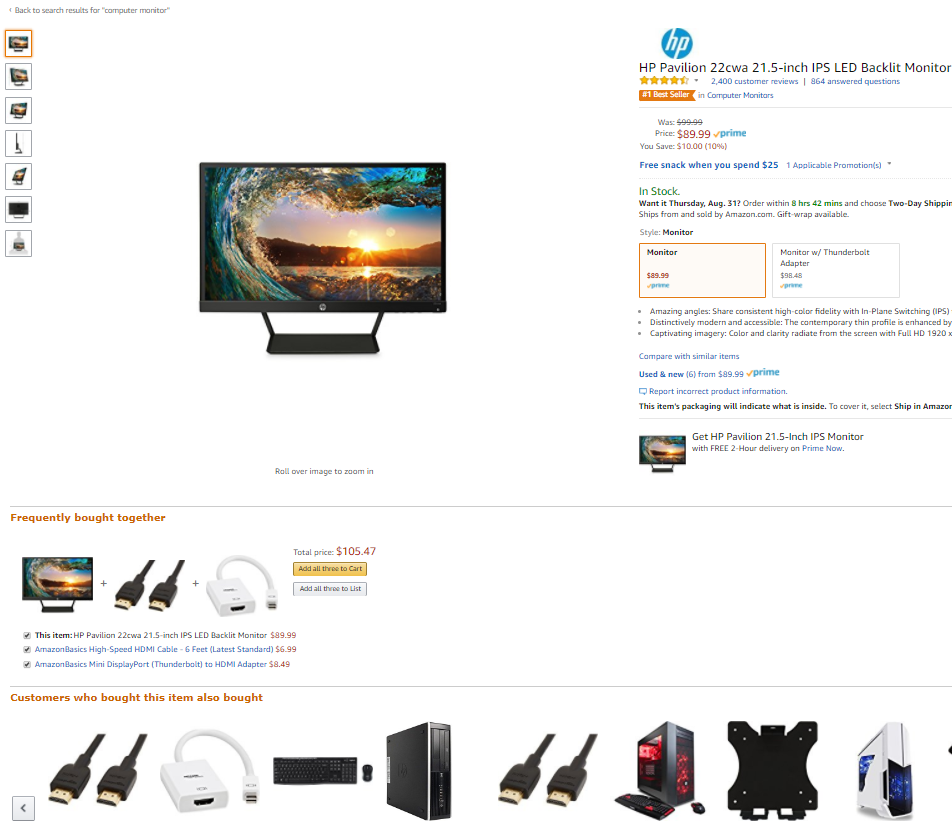
A combination of interlinking and cross-selling is a very powerful strategy to implement. Creating a “People Also Viewed” section on a website is a great way to draw attention to more popular pages or relevant content to improve user flow. If your navigation patterns leave something to be desired, interlinking your pages is one of the best things you can do increase engagement across your website.
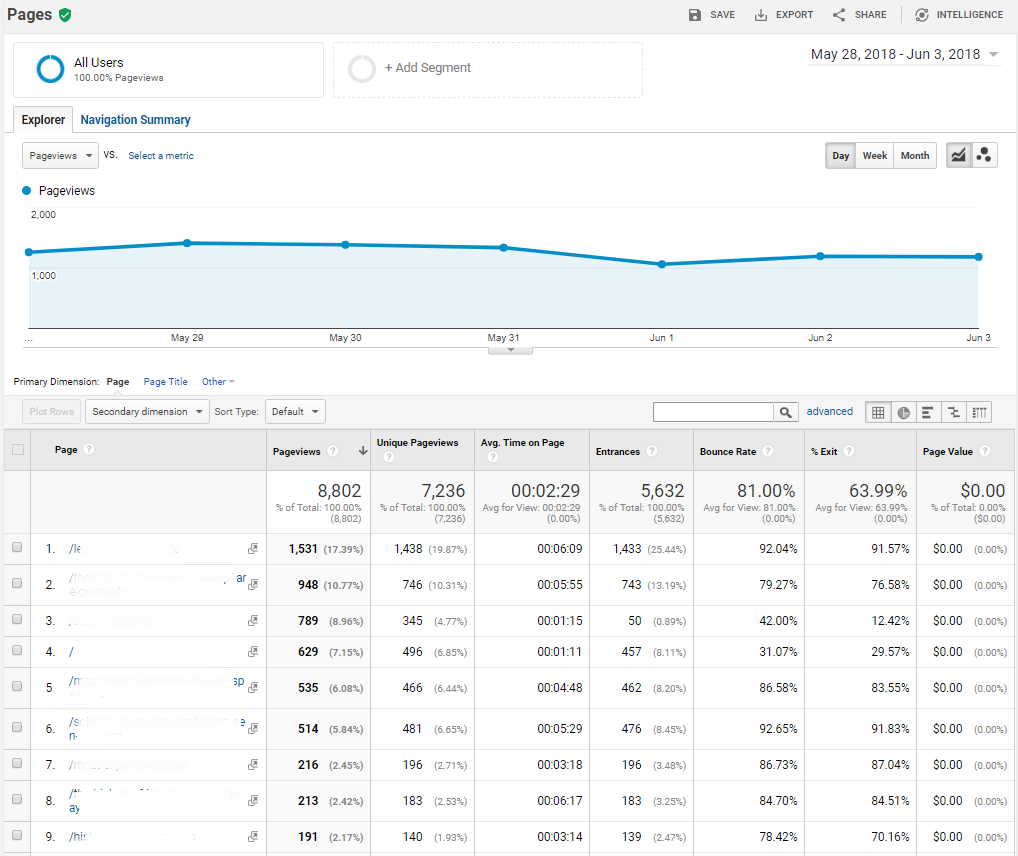
Site Content
The Site Content section is used to check the audience engagement with different pages on your website.
Whether it’s revealing the location of the audience who have arrived on a particular page, the source in which they came, the browser they were using, etc., this section enables you to analyze the finer details of any page on your website with the help of Secondary Dimensions. These allow you to clearly define your primary dimensions and see the data within that table. An example of a secondary dimension setting would be “City.” Using this, you can see where exactly the referral traffic is coming from to get a glimpse of where your presence is strongest (or weakest).
Throughout analyzing your Site Content reports, here are the major terms you need understand.
- Unique Pageviews: Number of sessions during which the specified page was visited at least once.
- Avg. time on Page: The average amount of time users spent viewing a specific page or pages.
- Entrances: Number of times visitors entered your site through a specified page or set of pages.
- Bounce Rate: Percentage of single-page sessions of which ended without an interaction.
- %Exit: Number of exits/Total number of pageviews.
- Page Value: The average value of this page or set of pages. Page Value is (Transaction Revenue + Total Goal Value) divided by Unique Pageviews for the page or set of pages.
- Landing Page: The pages through which visitors entered your site.
- Sessions: A group of interactions users take within a certain timeframe. A session is the period time a user is actively engaged with your website, app, etc. All usage data (screen views, events, e-commerce, etc.) is associated with a session.
- New Sessions: An estimated percentage of first-time visits.
- New Users: The number of unique visitors during a selected timeframe.
- Pages/ Session: Pages/Session (Average Page Depth) is the average number of pages viewed during a session. Repeated views of a single page are counted.
- Average Session Duration: The average length of a session.
- Goal Conversation Rate: The sum of all individual goal conversions.
- Total Goal Value: The total value produced by goal conversions on your site. This value is calculated by multiplying the number of goal conversions by the value you assigned to each goal.
- Exits: Exits are the number of times visitors exited your site from a specified page or set of pages.
- %Exit: %Exit is (number of exits) / (number of pageviews) for the page or set of pages. It indicates how often users typically exit from that page or set of pages after viewing it.
Secondary Dimensions
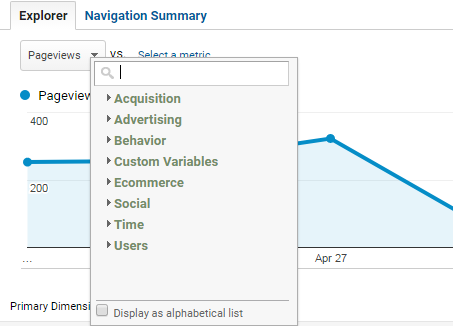
- Acquisition: This metric tells you the source of the traffic that comes to your web pages.
- Advertising: Let’s you know about the all the metrics related to Google AdWords campaigns.
- Behavior: Shows you the navigation patterns of which users take when visiting your pages.
- Custom Variables: These allow you to record additional data that is not standard to Google Analytics. These can be used as filters in the View Level. Doing this enables you to confine a certain subset of your audience for deeper analysis.
- E-commerce: If you are an e-commerce website, the main metric for you to study will be the behavior of transactions. This dimension will help you with this.
- Social: Helps you calculate data related to social media engagement of a specific link.
- Time: Provides you the data about the engagement of a page for a certain time format.
- Users: Provides you the individual data sets of the audiences that have visited a certain page.
Site Content involves four categories:
1. All Pages
The primary dimensions in this category are Page and Page Title. From here, you can check the data either by page URL, or by the title.
The main focus of this category is on the secondary dimensions. These provide the small, actionable details about a particular webpage. The secondary dimensions will remain the same for all the sections under Behavior.
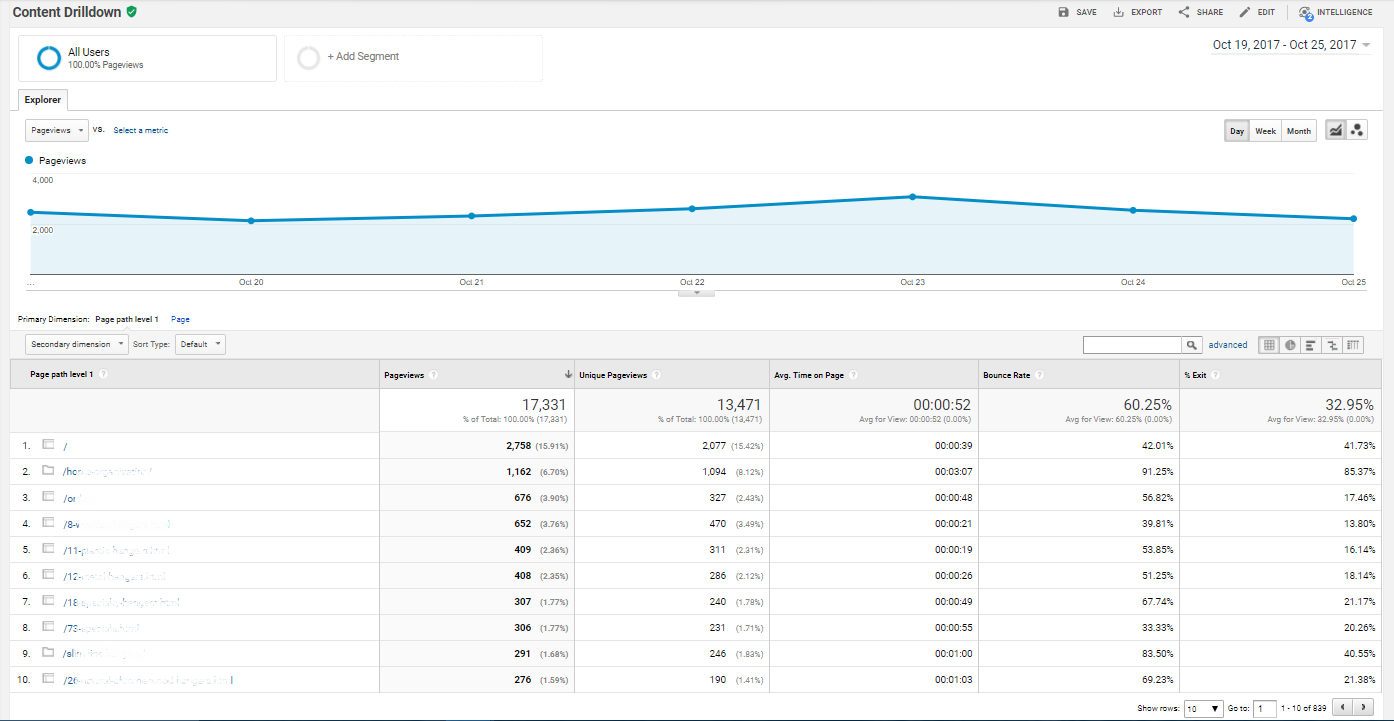
2. Content Drilldown
Content drilldown is a feature in Google Analytics that allows you to see how people are interacting with your content. Useful when you want to analyze data from the folders and subfolders.
This is less significant with smaller websites with fewer pages to navigate.
It is highly useful for e-commerce websites with a lot of categories and subcategories. For example, a content drilldown would look something like: Home/Electronics/Computers/Laptops. Analyzing this data can shed light on audience engagement with different folders through secondary dimensions.
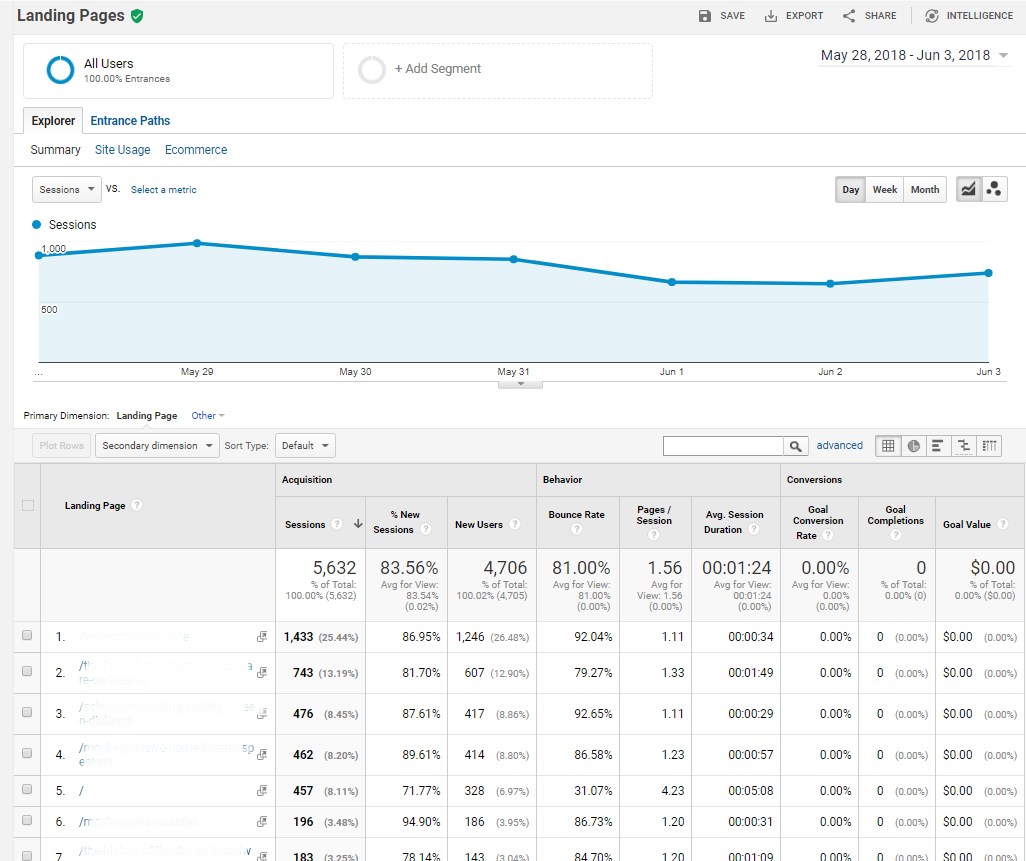
3. Landing Pages
This category gives you data on all the landing pages of which people used to navigate their way to your website. For example, if your site was mentioned in an external blog post, or you wrote guest posts on certain sites, this category will give you a rundown of all the traffic that resulted from those pages.
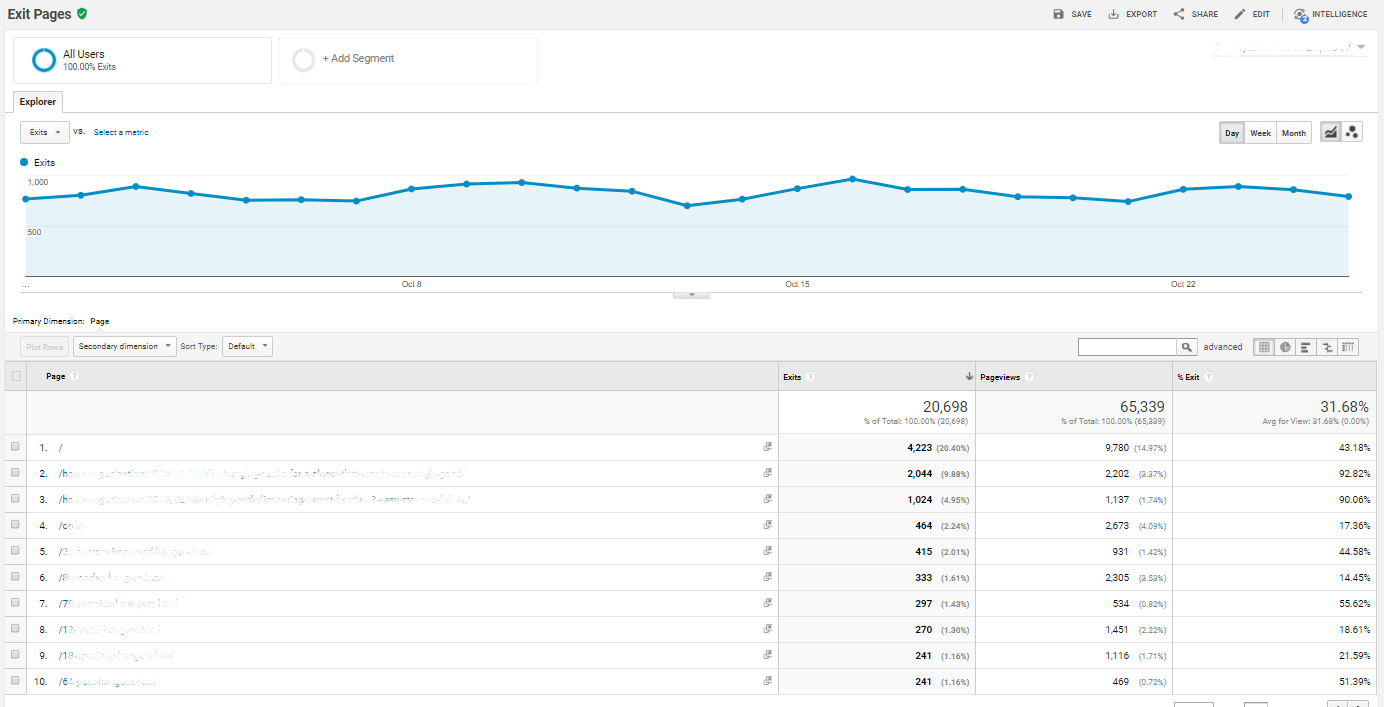
4. Exit Pages
The Exit Pages category provides detailed data about the pages from which users exit your website.
The ultimate goal of building any website is to engage the audience for the maximum amount of time. If a user does not find the content on your website relevant, they may leave instantly. They may also navigate through different pages and then exit after some time.
Consider the website of a service provider. If the %exits is high on other pages and the pageviews are low on the actual service page, that typically means users are leaving the website without viewing the most important page on the platform, which is a sign of worry.
Similar for e-commerce websites, if %exits are high on product pages, rather than the payment page, this means users are not interested enough in that particular product and are being turned off before converting. This can mean a lot of different things. Perhaps your descriptions need work. Maybe the pictures aren’t giving the user enough information to decide. Whatever the issue may be, this is a red flag that you need to spend time and improve your product pages.
If the number of unique users leaving the payment page is higher than the ones making the payment, the site owner needs to analyze the payment page and see if there are any blaring issues discouraging users to make the payment.
Site Speed
How quickly (or slowly) your website components load can make or break your platform and how visitors interact with it. Ultimately, it’s quite simple. If your pages take forever to load, most people will leave your site without taking any positive action. Generally speaking, today’s web users are an impatient bunch. Therefore, your site speed needs to be lightning-fast to keep people tuned in.
There are so many different factors that play into this. The Site Speed section helps to understand different areas of your website that may be affecting your overall speed.
Even after performing a rigorous on-site SEO check, there might be some undetected errors that may be affecting load times. With the help of the site speed section, you will not just be able to detect these issues, but Google Analytics will provide a detailed solution to implement.
Due to the intricacy of website speed, this section requires close attention to detail in order to glean the proper insights.
Overview
The overview gives you a surface-level measurement of numerous timings that affect your overall site speed.
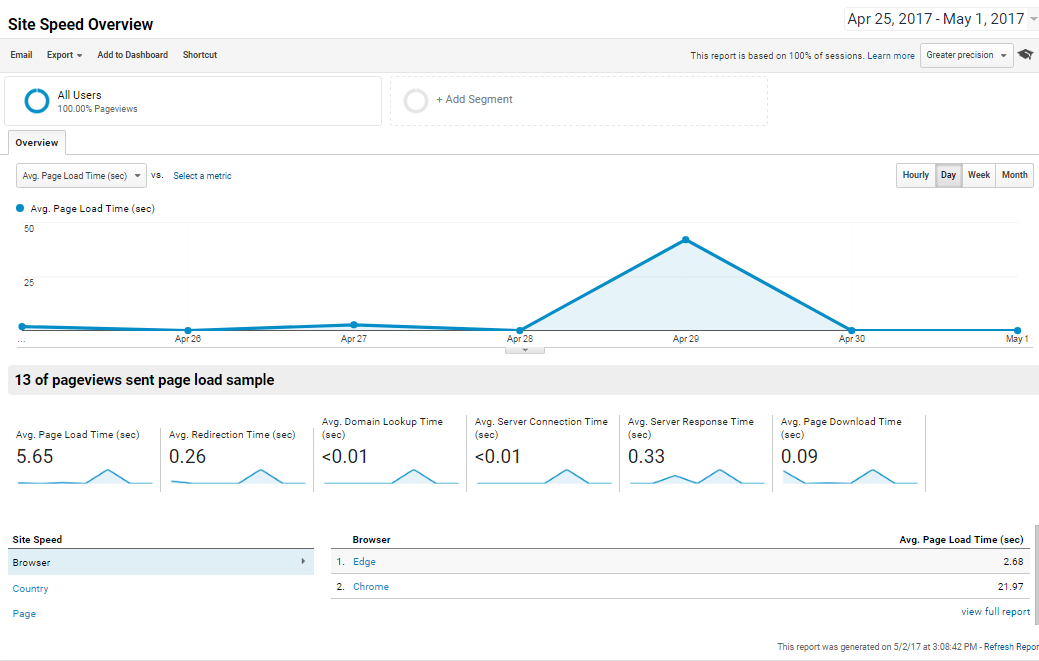
The major metrics in this section will give you a summarized view of how each facet plays into your website’s performance.
- Average Page Load Time: This section takes all of the individual pages on your platform and calculates the average time (in seconds) they take to load. The clock starts from the moment the user clicks on the link to when all the content has been completely loaded onto the browser. This metric is perhaps the most important in gauging your website. If the number is high, it is time to do some problem solving. Keep in mind, it might not always be the content that’s bogging down the load times. There could be lots of potential culprits. Some might even be beyond your control; this includes things like user location or network connection.
- Average Redirection Time: This metric refers to the seconds it takes for users to move from one page to another – the time they spend in redirection. If there are no redirects on your website, this number will be 0.
- Average Domain Lookup Time: This part is in relation to the timeframe in which the user’s browser searches and finds your website’s IP address. The number is typically higher if your content comes from multiple domains. Domain Lookup Time will be one of the smallest numbers on your report. Your hosting solution is an important factor in determining this metric.
- Average Server Connection Time: Another small number, this takes place after the domain lookup is complete. From here, the server connects the IP addresses of your domain and device.
- Average Server Response Time: When users are navigating through your website, this metric accounts for how long it takes for the server to react to their behavior. The user’s network and location play a big role in this number.
- Average Page Downloaded Time: This number represents a portion of the Average Page Load Time. By the time this metric gets determined, the HTML (DOM) of the page has completely loaded, but it still needs images and other visual effects. The timeline starts once the HTML has been loaded and ends when the visual components have completed.
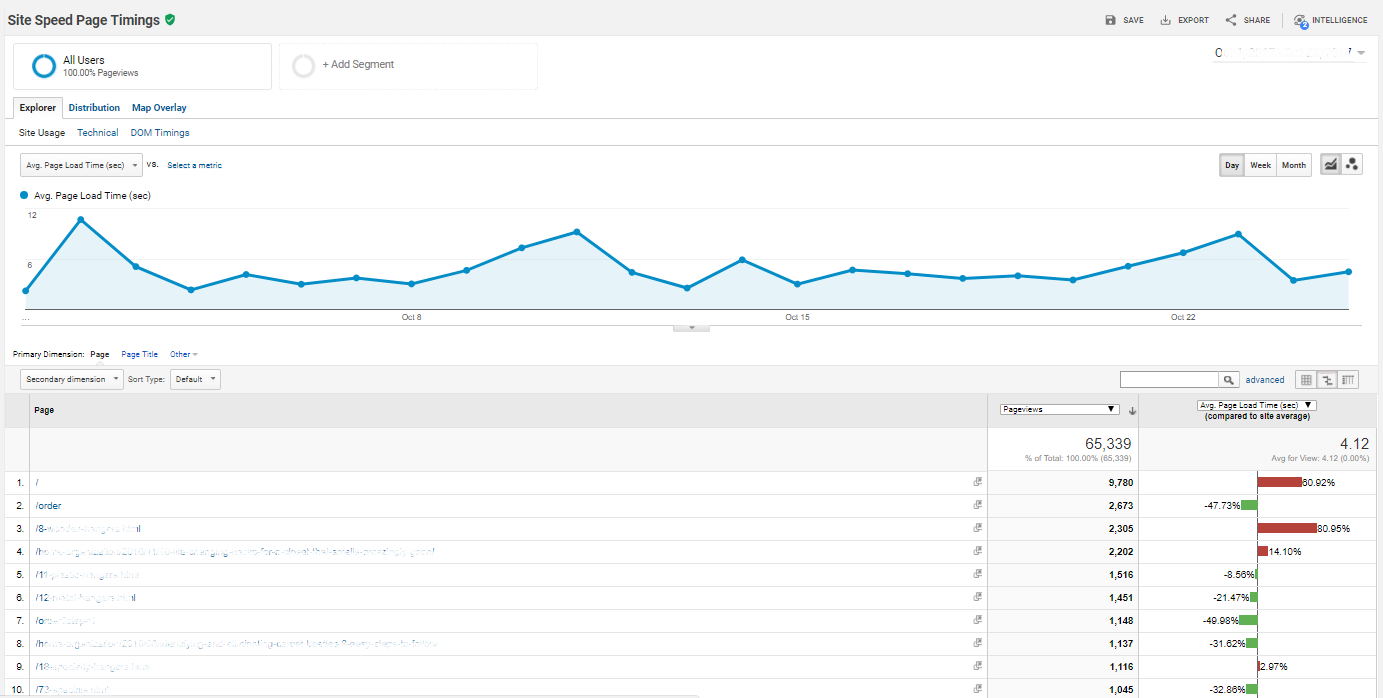
Page Timings
The page timings show you a more detailed report on the loading times for each the pages on your website. These numbers can be compared to the overall speed of your website.
These reports include three major tabs:
- Explorer: Data for each page based on different primary and secondary dimensions.
a. Site Usage: Surface-level interaction metrics like pageviews and bounce rate.
b. Technical: Metrics of the network/server.
c. DOM Timings: Document-parsing metrics. - Distribution: Timing buckets that reveal data on whether your pages and resources are loaded and executed within a healthy timeframe.
- Map Overlay: Data in relation to the geographical context of various primary and secondary dimensions.
Speed Suggestions
The Speed Suggestions are there to give you optimization tips specifically geared towards your website.
If there are any issues affecting site speed of a particular page, this option can help you out. For every page, suggestions will be provided under the Page Speed Suggestions column. Clicking on the number will redirect you to a new page where suggestions will be provided on how to solve these issues.
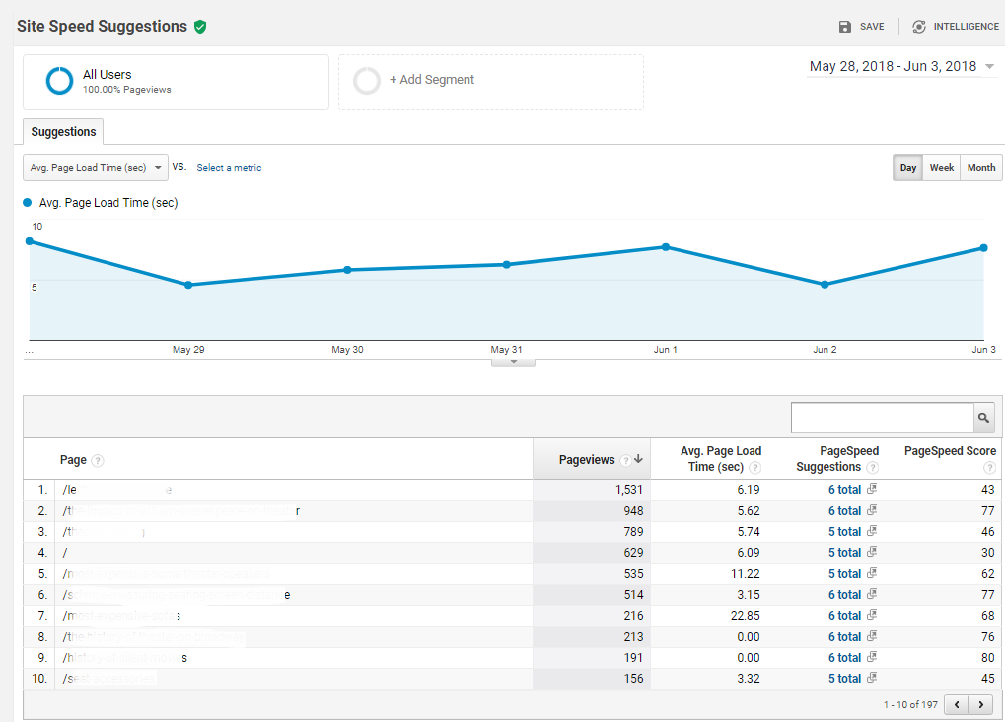
Definitions under Speed Suggestions:
- Page Speed Suggestions: The number of optimization recommendations to help make your page load faster. Click the link to open the Page Speed Insights page. This contains details about how to implement the recommendations.
- Page Speed Score: This indicates the extent to which you can improve the load time of a page. The score isn’t a measurement of speed, but only the extent to which the speed can be improved.
- Avg. Page Load Time: Average amount of time (in seconds) it takes for pages from the sample set to load. To start the initiation of the page view, click on a page link to load in the browser.
- Page: The page visited, listed by URL.
- Pageviews: Total number of pages viewed.
User Timings
For those who want to do a highly-detailed analysis, this section can be extremely helpful. If you are relying heavily on non-textual content like images, videos, and forms with buttons and want to analyze the performance of these elements on your website, this is where you can do so.
Site Search
The best way to know your user is to learn how their brain functions in relation to your website. This is where the search option of your website plays a major role.
When most people arrive on a website, they are hoping to find the content of their interest without navigating to additional pages. For this reason, they will make use of the Search Option by entering the desired query.
Site Search lets you understand the extent to which users took advantage of your site’s search function, which searches terms they entered, and how effectively the search results created deeper engagement within your site.
To use this option, you first need to setup a site search.
This can be incredibly handy for e-commerce websites with extensive catalogs. It’s a common practice for users to go directly to the search option to pinpoint their desired product. All the data related to these searches made by the user is available in this section.
Additionally, this section provides data-backed insights in terms of listing performance. For instance, there might be some products listed on your site that you thought were going to be heavily sought-out. But, the Site Search report tells you otherwise. When this is the case, it’s a sign you need to rethink your strategy.
For service providers with a large number of offerings, it’s a safe bet that users will immediately turn to the search. These reports make it easy to find which ones are the most popular.
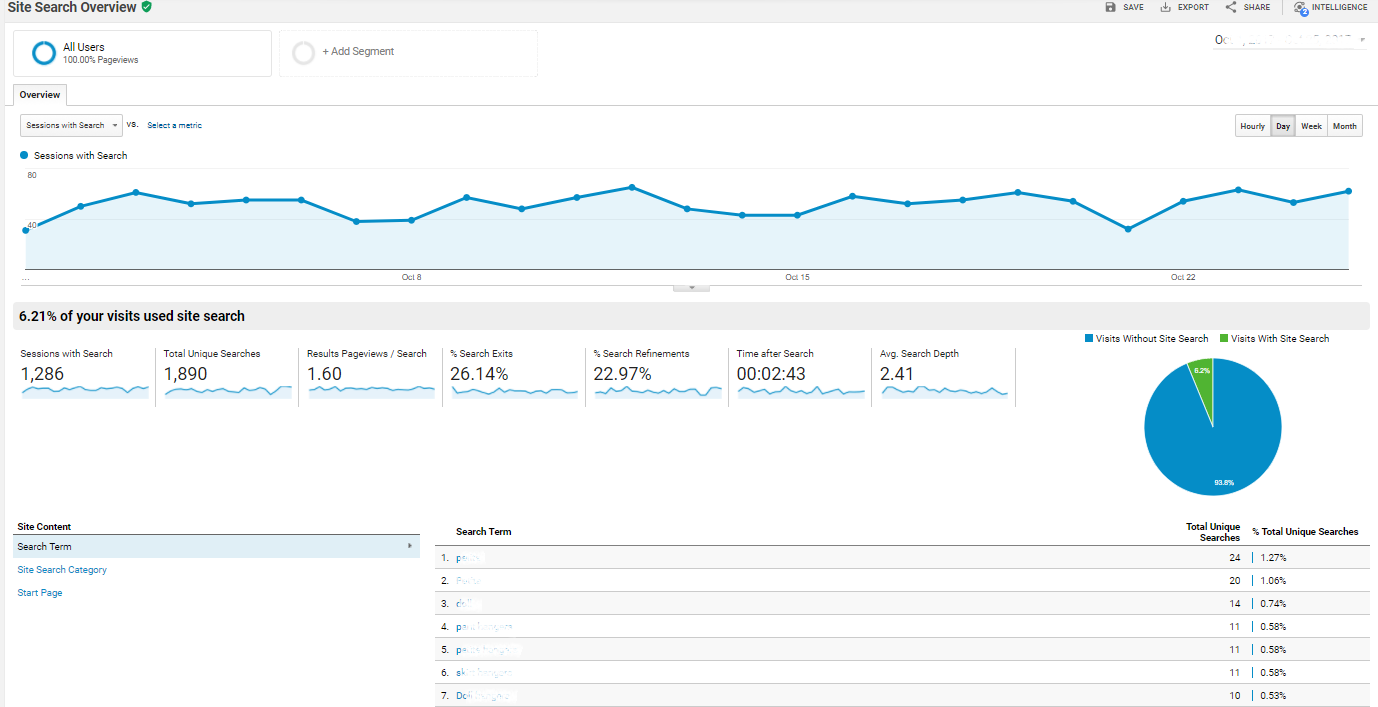
Overview
The overview shows all the averages of your website’s search-related data, along with the top ten query terms entered by the user. It also shows you the top pages from where most people used the search option for the first time after arriving on your website.
Users may land on your website from a myriad of sources. It could be directly from a particular page through any of your backlinks, through a page in the search results, social media, etc. Once they land on your page, there’s a good chance they will start their browsing through the search option. Additionally, they might arrive on your homepage and navigate a few pages before searching their desired item in the search bar.
Site Search helps you track all this data of which you can then use to optimize for maximum audience engagement.
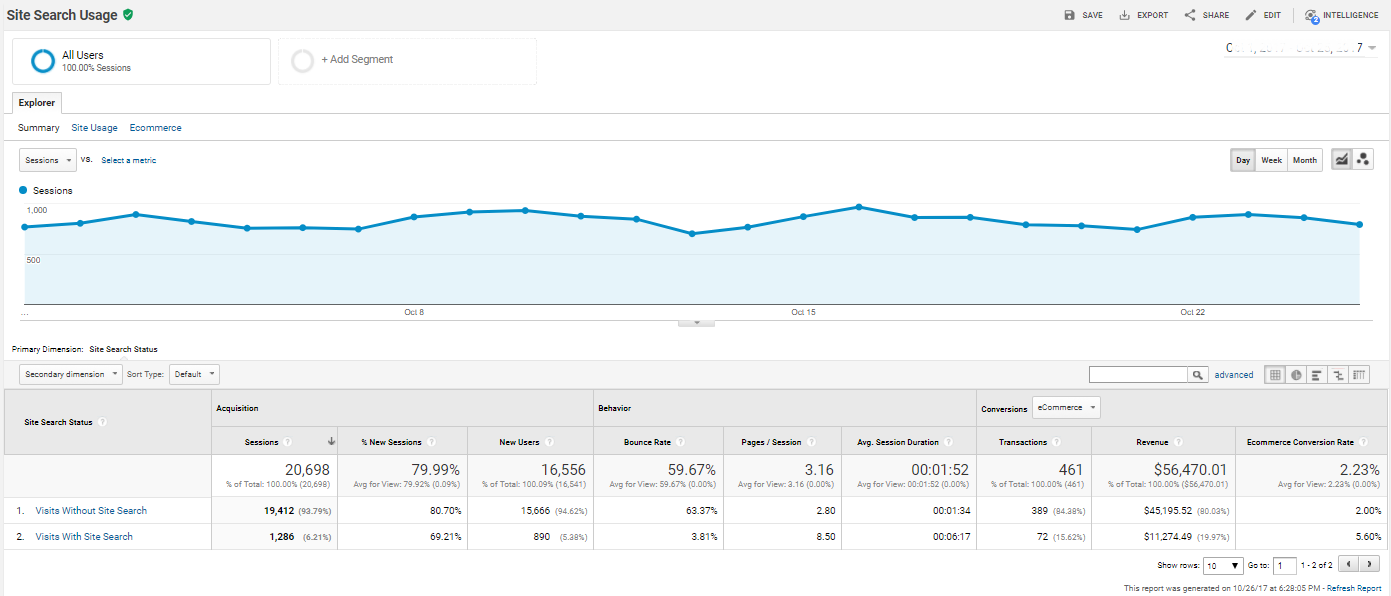
Usage
This report encompasses two rows of data. The first one is for visits that included a site search, the second one is visits that did not. These metrics help you gauge the success rate (in terms conversion rates) of those who used the search option.
Comparing these two data columns gives you an idea of how worthwhile this function is.
Definitions under Search Usage:
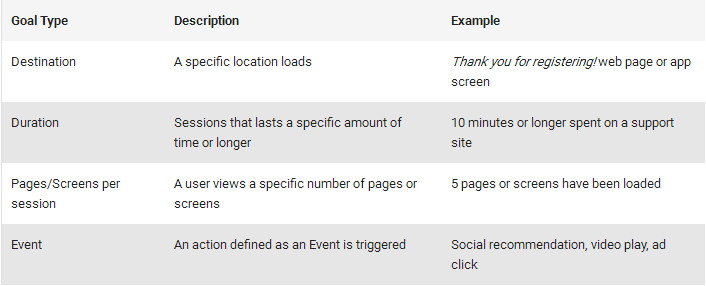
- Goal: These measure how well your site or app fulfills your target objectives. A goal represents a completed activity, or a conversion, that contributes to the success of your strategy. Examples of goals include making a purchase (for an e-commerce site), completing a game level (for a mobile gaming app), or submitting a contact information form (for a marketing or lead generation site).
Here are two important metrics that pertain to goals:
- Goal Conversations Rate: The sum of all individual goal conversion rates.
- Goal Value: The total value produced by goal conversions on your site.
Search Terms
This shows the data of all the terms used in the search option by users. It’s here where you see what exactly people are looking for on your site. You see each query alongside of the search usage metrics. Reports for Goals in relation to e-commerce are also available here.
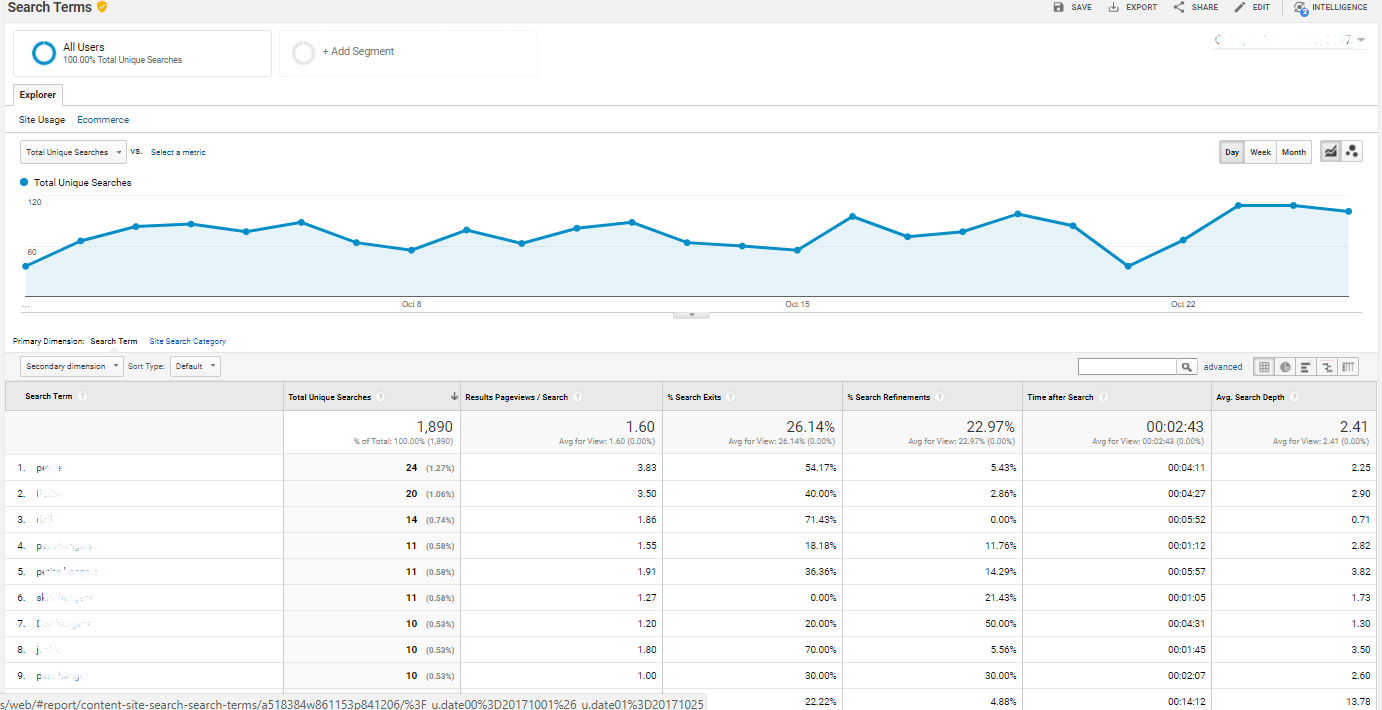
The Search Terms report goes pretty in-depth.
There are all kinds of valuable insights to gain from this section. A few of the big ones include:
- Number of pages it took people to find what they want.
- How persistent users were in their search.
- Areas of the site people searched for, rather than navigated to.
- Most popular queries.
- Common misspellings.
- Searches with the highest conversion rates.
Search Pages
This part shows exactly where visitors were on the site when they decided to make a search, then shows where they ended up. This report can be very useful in determining which pages might need to be updated to give users more information.
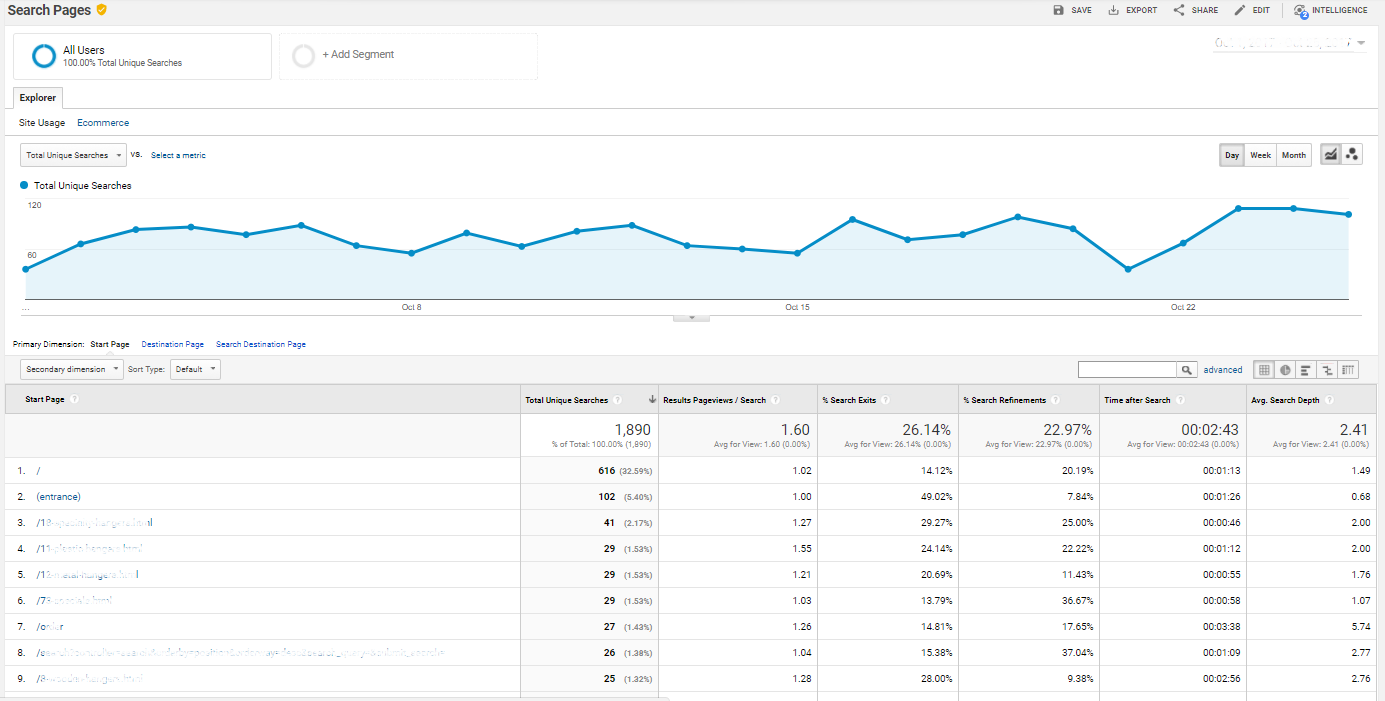
Definitions under Search Terms & Search Pages:
- Search Term: The words or phrases visitors used when searching your site.
- Total Unique Searches: The number of times people searched on your site. Duplicate searches within a single visit are excluded.
- Result Pageviews/Search: The average number of times visitors viewed the search results page after performing a search.
- %Search Exits: The number of exits from your site that occurred following a result from an internal search.
- %Search Refinements: The total number of times a refinement (transition) occurred between internal search keywords within a session.
- Time after search: The amount of time visitors spent on your site after getting results for the search term.
- Avg. Search Depth: The number of pages visitors viewed after getting results for the search term.
Events
Events are the interactions users have with your content. Suppose you have uploaded a video or an app and want to track how well it performed (plays and downloads). You can analyze their performance through events section.
For this option, you need to setup event tracking first.
These events can be tracked independently from a webpage or a screen load. Downloads, mobile ad clicks, gadgets, Flash elements, AJAX embedded elements, and video plays are all examples of actions you might want to track as Events.
Events are made up of three parts.
- Event Category: This is the name you provide to put certain objects in groups to be tracked. Generally, these names will be used multiple times in relation to UI elements. Examples would be things like videos, guides, demos, etc.
- Event Action: You will name these events based on the user interactions for each category. For example, if the category is videos, actions would include things like plays, pauses, stops, etc.
- Event Label: You can use labels to provide additional information for certain events you are tracking. This can help specify what is what, like the actual name of a video.
Let’s say you have uploaded a video want to measure how many times the play button was clicked. You’ll want to do Event Category = Video, Event Action = Play, Event Label = Name of the Video.
Similarly, if you want to analyze events for an app. Go to Event Category = App, Event Action = Click, Event Label = Latest News.
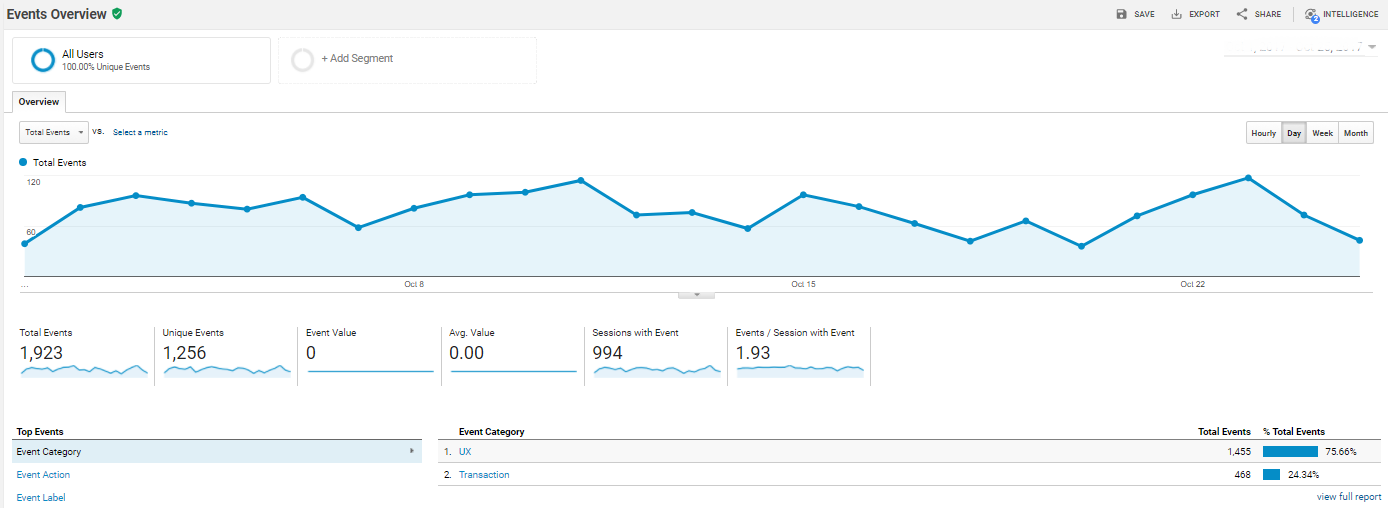
Overview
This dashboard will show you the big picture of all the events taking place on your website.
Top Events
This metric shows you the leading events based on performance across your website.
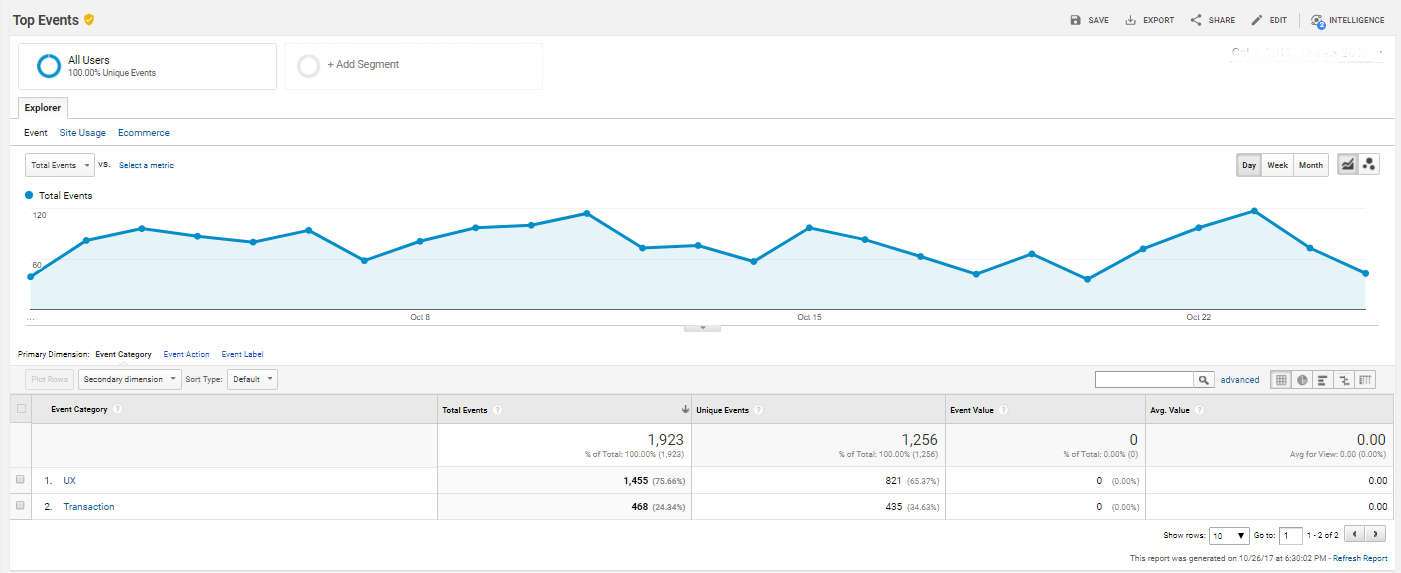
Definitions under Top Events:
- Event Category: The categories that were assigned to triggered events.
- Total Events: The number of times certain events occurred.
- Unique Events: The number of times an event with the category/action/label value was seen at least once within a session.
- Event Value: The total value of an event or set of events. It is calculated by multiplying the per-event value by the number of times the event occurred.
- Average Value: The comprehensive value of all your events.
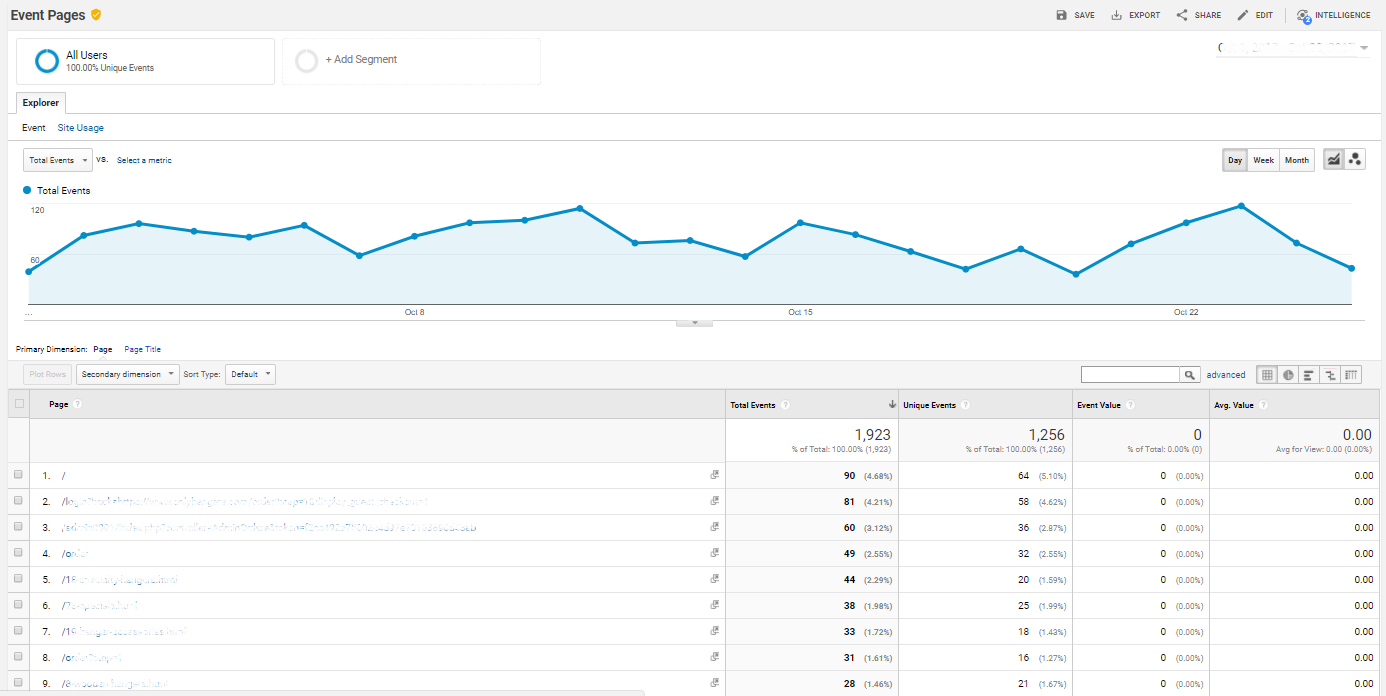
Pages
In this section, you will see the performance of each individual pages associated with an event.
Events Flow
The Events Flow report will visualize the order in which users trigger the Events on your site. Events enable you to track special content like videos, downloadable items, and embedded gadgets. This report can help you discover which Event content keeps users engaged with your site, as well as the paths they take from one Event to the next.
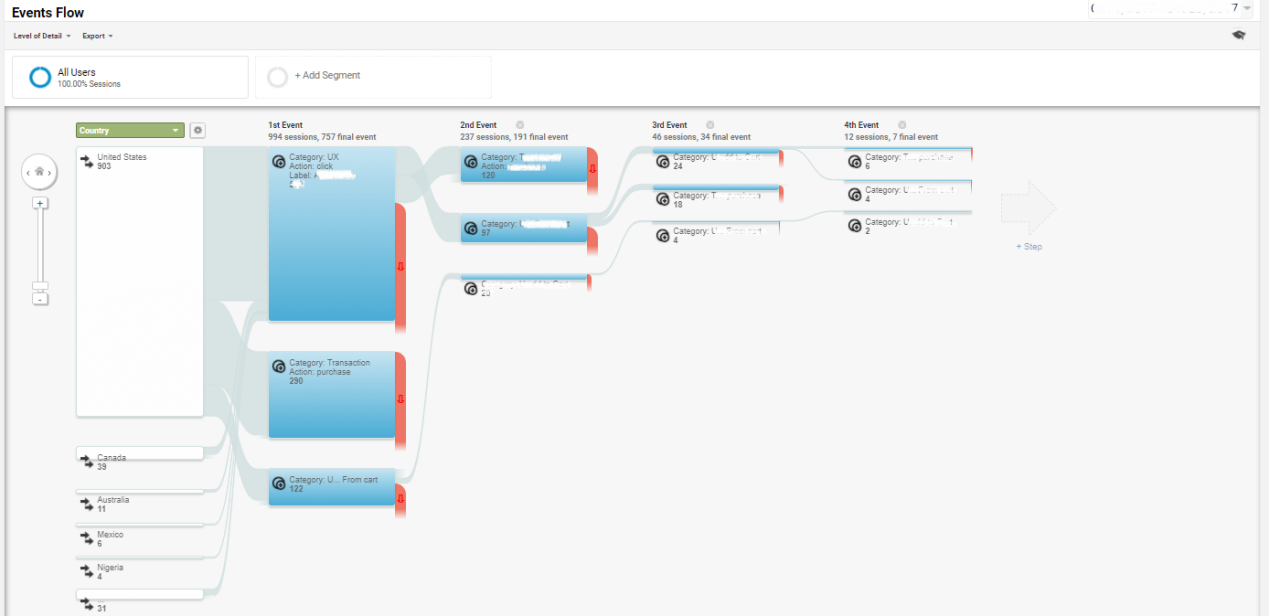
This report is great for answering important questions like:
- How exactly do some events lead to other events?
- What are the most popular event categories?
- How many times are certain events triggered?
Publisher
The Publisher section helps you analyze all the data related to the advertisements being displayed on your website. This can ultimately help you to improve the quality of each ad you would like to show on your website.
Ads are displayed on your website in relation to certain entries that you made while setting up Google AdSense.
If your Publisher CTR is low, meaning the number of impressions is more but clicks are less, it might be time to update your AdSense.
There are three main sections to this report:
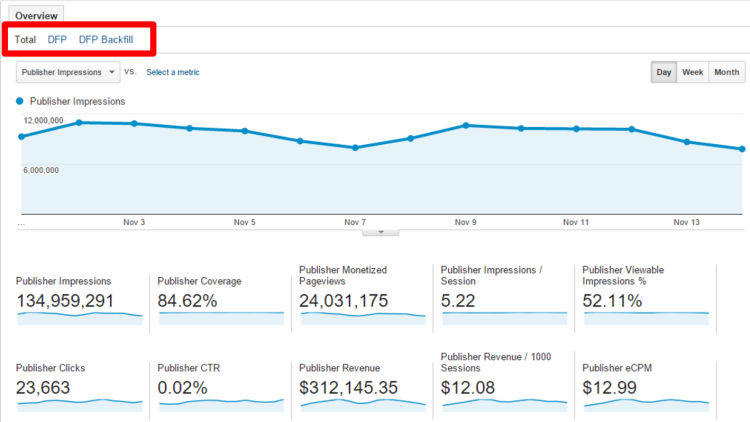
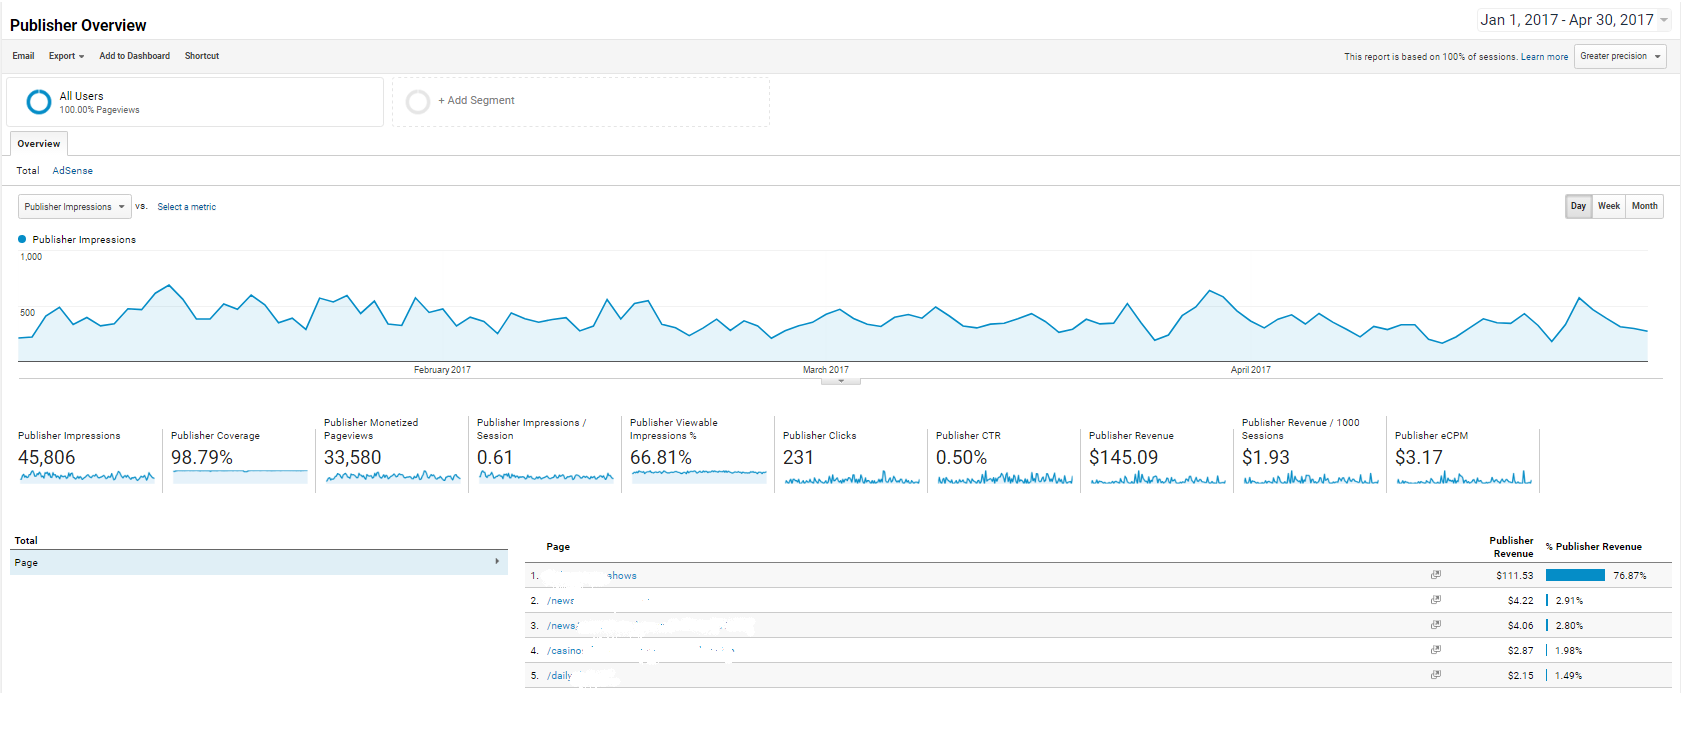
1. Overview: Defining summary of your most important metrics.
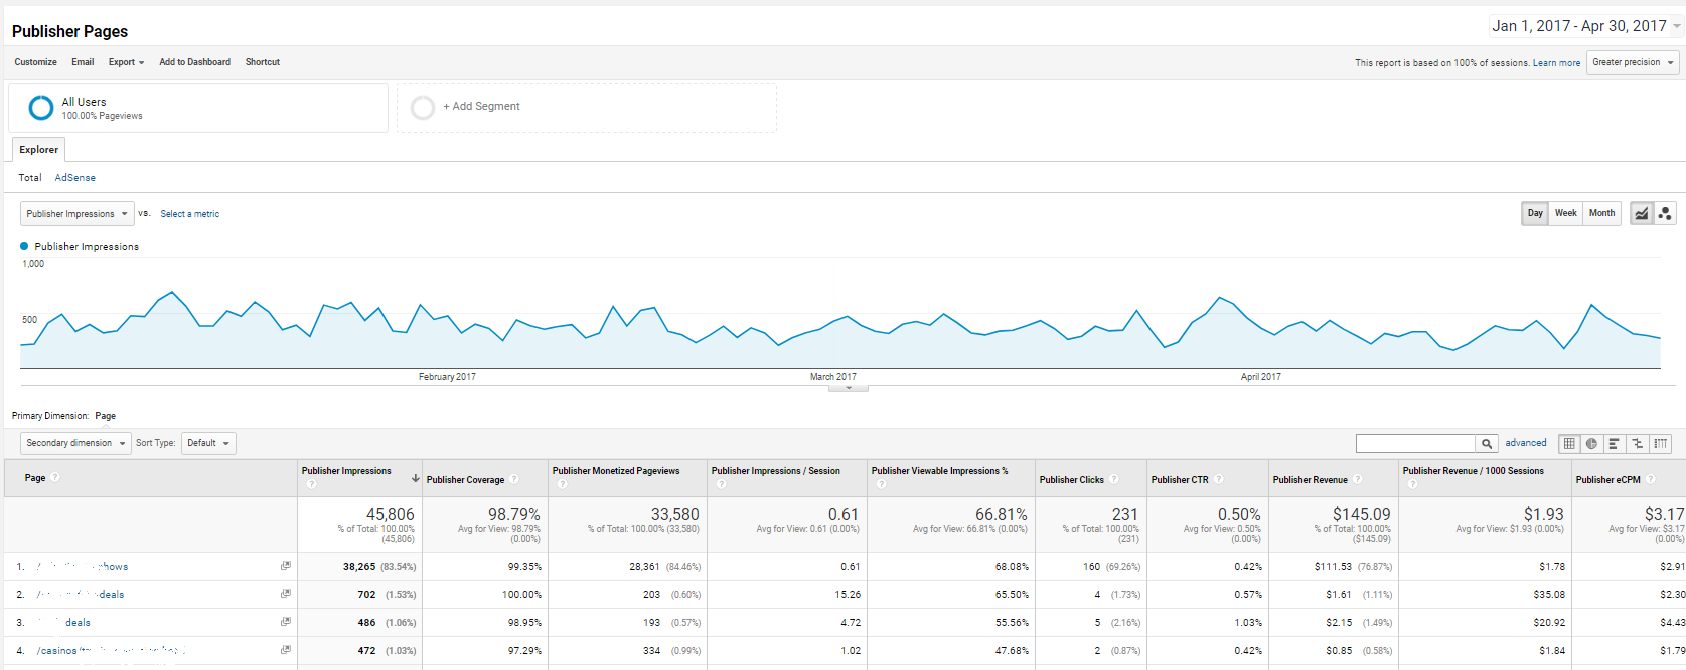
2. Publisher Pages: Shows the data on which your site’s pages have contributed to the total amount of impressions. This is the top-to-bottom list of your pages of which the AdSense ads have been viewed via publisher sites. It shows the data for each landing page with all the metrics discussed in the overview section.
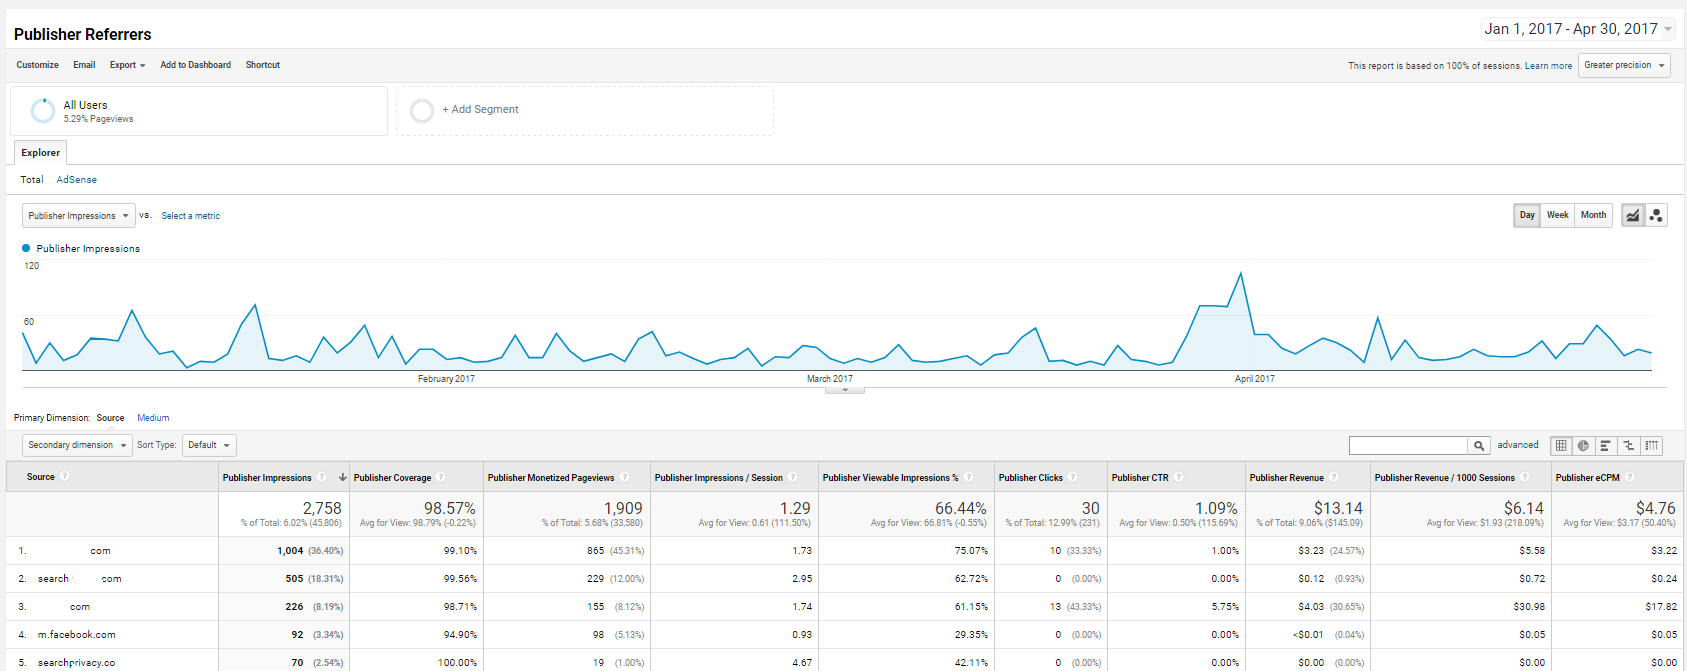
3. Publisher Referrers: Shows you the external websites that have contributed to the total amount of revenue, clicks, impressions, etc. This section gives you a data-driven visualization of how these sites or links referred AdSense ad impressions on the publisher website.
Key Definitions under Publisher Overview
Publisher Impressions: These are reported whenever an individual ad is displayed on your website. For example, if a page with two ad units is viewed once, there will be two impressions displayed.
Publisher Coverage: The percentage of ad requests that came back with a minimum of one ad. Typically, this helps you to pinpoint the sites where your publisher account (AdSense, AdX, DFP) cannot display targeted ads. Here is the formula: (Ad Impressions / Total Ad Requests) * 100.
Publisher Monetized Pageview: This metric measures the total amount of pageviews on your platform shown with an ad from a linked publisher account (AdSense, AdX, DFP). One ad page can have multiple units.
Publisher Impressions/Session: The ratio of linked publisher accounts (AdSense, AdX, DFP) ad impressions and Analytics sessions. This is the formula: Ad Impressions/Analytics Sessions.
Publisher Viewable Impressions: The percentage of viewable impressions. Impressions are deemed viewable when the user has the opportunity to see it in their browser.
Publisher Clicks: The amount of times ads from linked publisher accounts (AdSense, AdX, DFP) were clicked while being displayed on your site.
Publisher CTR: Metric that compares total pageviews to clicks on a linked publisher account ad (AdSense, AdX, DFP).
Publisher Revenue: Total estimated amount of revenue all linked publisher account ads (AdSense, AdX, DFP) brought in.
Publisher Revenue / 1000 Sessions: Total estimated amount of revenue all linked publisher accounts (AdSense, AdX, DFP) brought in, per 1000 Analytics sessions.
Publisher eCPM: The cost of pageviews in thousands. This is the total estimated revenue brought in from all linked publisher accounts (AdSense, AdX, DFP) per 1000 pageviews.
Experiments
Experimentation is what makes analytics so useful (and interesting). It’s here where you are able to test variations of landing pages to help reach your goals in the most effective way.
You are able to apply all kinds of different variations and see exactly how it impacts your bottom line.
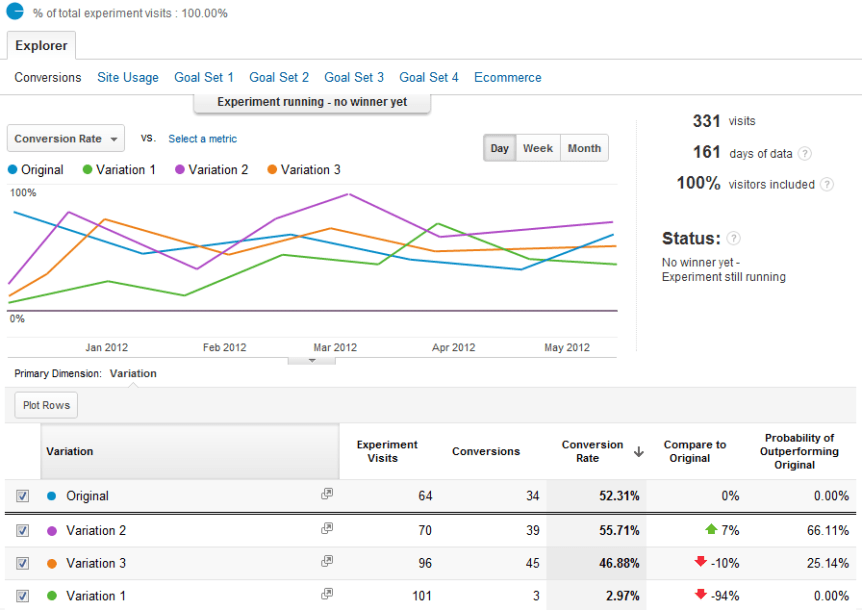
This should be a constant process throughout all of your efforts. Conducting an online operation in any capacity is a never-ending quest to improve conversion rates, sales, traffic, etc.
In Conclusion
Behavior Analytics is one of the most fascinating aspects of running a business (or any operation) online. This data essentially gives you an in-depth look at how users’ minds function and how they relate to the digital world around them. While Google Analytics will give you all the objective metrics you need to inform your decisions, the real results come from how you use this information to refine and advance your strategy. If there is anything else we can do to help clarify how Behavior Analytics works, please let us know!