If you are familiar with Google’s Data Studio, you know that it packs a punch! Data Studio is part of the Google Analytics 360 Suite, which was released by Google back in 2015. The underlying purpose of this reporting service is to turn your analytical data into illuminating reports that are easy to customize, interpret, share, and track marketing ROI.
These days, it’s no secret that your Google My Business (GMB) insights can be a goldmine of information to advance your digital presence. But, this can only happen if you properly connect the dots.
For a long time, the biggest challenge for Google My Business users were reporting, analyzing, and accurately leveraging their performance data – especially for businesses with multiple locations.
Regardless of what your situation is on Google My Business, the two most important factors in getting the most valuable insights from your data come down to:
- Data Extraction
- Dashboard Visualization
In this post, we are going to spell out:
- How to get your GMB data connected to Google Data Studio.
- What all the dashboards mean.
What is in the Custom Dashboard?
The custom dashboard should be thought of as a central hub to see how people interact with your business via Google.
Here is a list of the major components you will see:
- General Overview
- Direct Searches
- Maps Views
- Search Views
- Phone Call Actions
- Local Post Views
- Local Post Actions
- Photos
- Searches
- Posts
- Maps
- Phone calls
- Driving Directions
- Last Quarter Results
How to Setup
The process of setting up your GMB data in Google Data Studio is relatively easy with the right connector.
For this purpose, we will use the trusted tool Jepto.
Ok, let’s dive into the process, shall we?
Step One
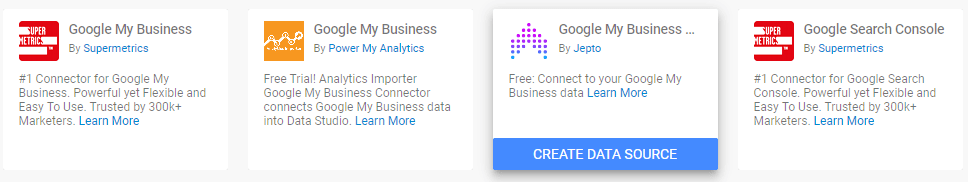
Start by visiting the main page for Google Data Studio. You’ll see a massive list of data platforms like Attribution 360, Big Query, Campaign Manager, and so on.
You’re going to want to scroll all the way down to Google My Business by Jepto and click on it to create the data source.
From here, you’ll need to fill in the necessary details.
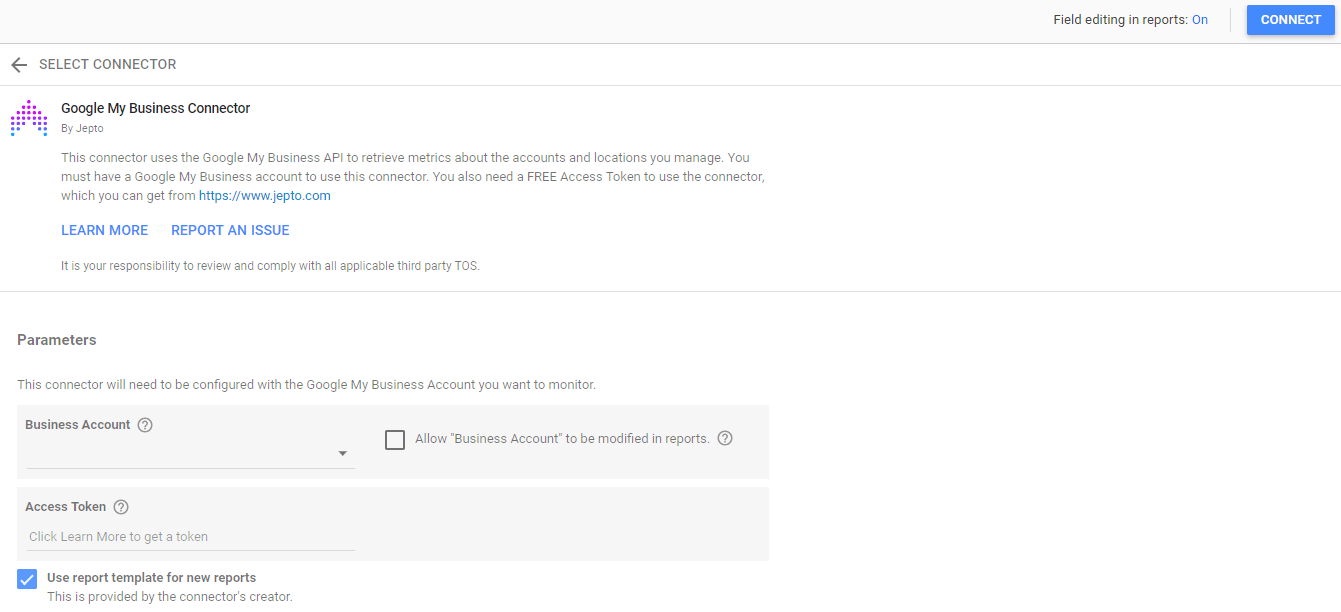
On the Business Account field, enter in the email ID associated with your Google My Business Account. Hit the checkbox titled Allow “Business Account” to be modified in reports.
Now, you are going to need the Access Token. Click on the Learn More link and you will be taken to the Jepto site. From here, click GET ACCESS, fill out the form, then check your email for the access information.
Once you have the token, enter the information and click Connect -> Allow
Step Two
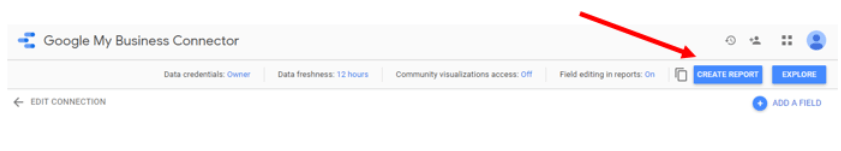
It’s time to create the report!
Simply click on the CREATE REPORT button.
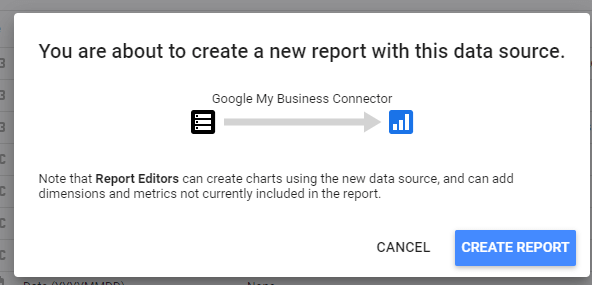
Boom!
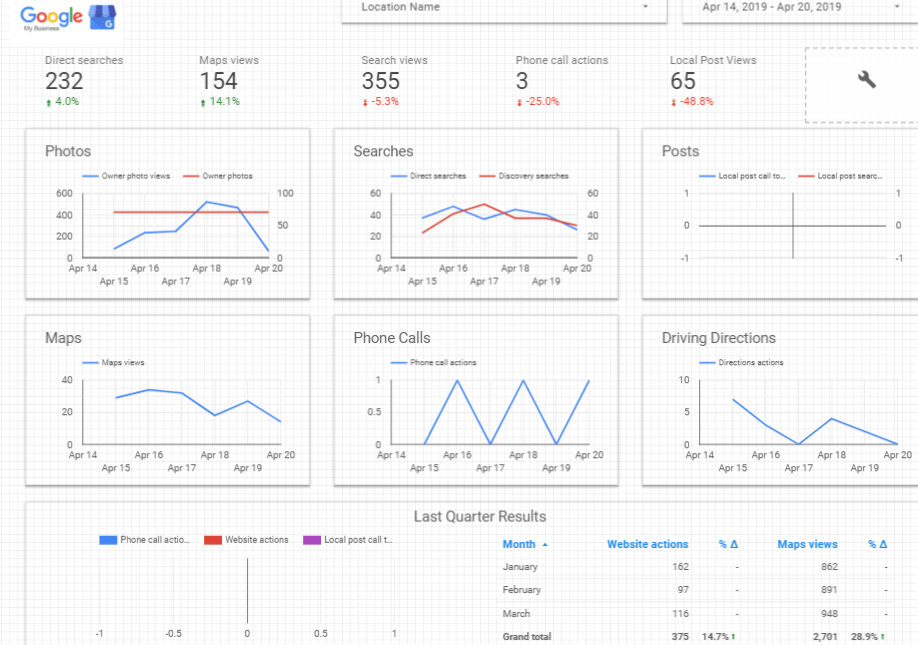
Now let’s take a look at the awesome dashboard!
Similar to how the Search Console dashboard shows you how people find your business online, this dashboard shows and an in-depth look at how people interact with it on Google.
Step Three
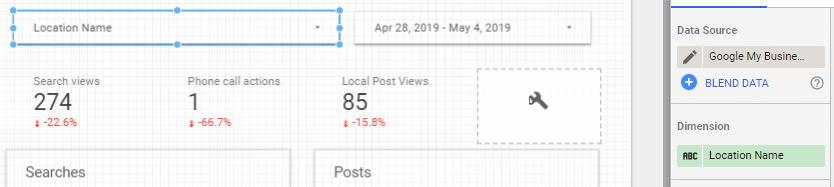
The last part of this easy setup process is getting all the names right.
For example, if you have multiple locations tied to your GMB data, you’ll want to change the Location Name to match. Or, if you just have one location, simply plug in your business name.
Keep in mind, Jepto isn’t the only good tool out there to connect your GMB data. We’ve had good experiences with Supermetrics, which is a paid tool.
What GMB Dashboards Can You Get in Google Data Studio?
The beauty of Google Data Studio is you can bring all your relevant dashboards together for linear insights.
In regards to GMB, there are several dashboards you can sync up. Essentially, all of this information ties back to how people interact with your GMB listing over a specified period of time.
So, let’s start at the top here.
- Choose Your Firm Name and Date Range:

- Dashboards Under “General Overview”
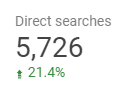
- Direct Search – Direct search refers to the interaction in which a customer searches for your business name or address. For us, this would involve someone directly searching for “E2M Solutions Inc.” – not SEO services, content marketing services, web design San Diego, or anything else of that nature.
- Map Views – This section refers to when someone finds your business via Google Maps, meaning they opened the application and typed your business name into the search bar.

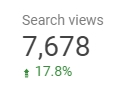
- Search Views – This is going to be similar to the data you find on Google Search Console. The Search Views show how many people found your listing by making a Google search.For us, this might have involved people typing in queries like web design agency in San Diego, digital marketing San Diego, content marketing services San Diego, etc.
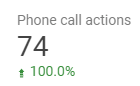
- Phone Call Action – Phone call actions are when someone sees your listing on GMB and clicks the icon to directly call your business via the phone number you set up.
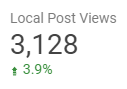
- Local Post Views – The local posts are where you can publish content on GMB to promote events, products, services, deals, and more. The Post Views tells you how many people looked at these posts.
- Local Post Action – This report shows you how many people interacted with your local posts. This can be related to visiting the website, calling your business, getting directions, and so on.
- Direct Search – Direct search refers to the interaction in which a customer searches for your business name or address. For us, this would involve someone directly searching for “E2M Solutions Inc.” – not SEO services, content marketing services, web design San Diego, or anything else of that nature.
- Map Views – This section refers to when someone finds your business via Google Maps, meaning they opened the application and typed your business name into the search bar.
- Search Views – This is going to be similar to the data you find on Google Search Console. The Search Views show how many people found your listing by making a Google search.For us, this might have involved people typing in queries like web design agency in San Diego, digital marketing San Diego, content marketing services San Diego, etc.
- Phone Call Action – Phone call actions are when someone sees your listing on GMB and clicks the icon to directly call your business via the phone number you set up.
- Local Post Views – The local posts are where you can publish content on GMB to promote events, products, services, deals, and more. The Post Views tells you how many people looked at these posts.
- Local Post Action – This report shows you how many people interacted with your local posts. This can be related to visiting the website, calling your business, getting directions, and so on.
- Direct Search – Direct search refers to the interaction in which a customer searches for your business name or address. For us, this would involve someone directly searching for “E2M Solutions Inc.” – not SEO services, content marketing services, web design San Diego, or anything else of that nature.
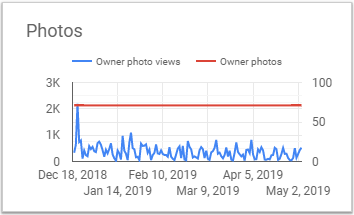
The dashboards you see above are more or less straightforward in giving you the raw numbers related to how many people interact with your GMB posting. When you get down to brass tacks, it’s the line graphs that give you the real granular insight.
- Photos – This line graph shows two different criteria. The red line indicates how many photos there are on your GMB listing. Often times, these are photos of the storefront, inside the business, view from the street, etc. This line generally stays the same, as many businesses have little-to-no need to consistently add new photos.The blue line represents how many times people view the photos you post over a specified timeframe. In some cases, there might be additional lines that compare you to other, similar businesses. This is common for restaurants in the same area.
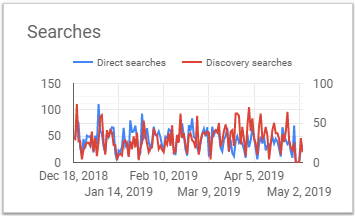
- Searches – The lines you see on this graph compare the direct searches (blue) to the discovery searches (red). In other words, you can see how often people interact with your GMB post from a Google search involving your business name versus searches that involve your industry or niche.
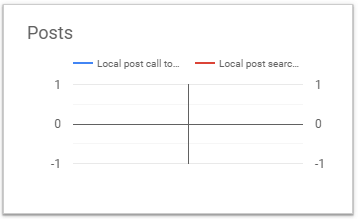
- Posts – This graph shows you how people are interacting with your local GMB posts. The blue line represents the times your call-to-actions were interacted with. The red line is the number of times your posts were interacted with via search.
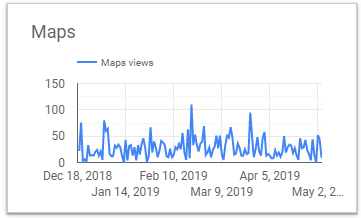
- Maps – The Maps graph shows you when people search for your business on Google Maps over a specified timeframe. These trends can definitely vary based on the business. Local businesses, like restaurants, barber shops, grocery stores, etc., will likely see a lot more activity on this dashboard.
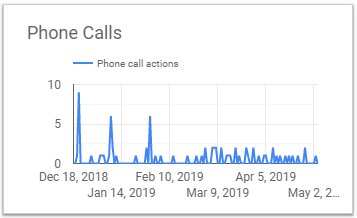
- Phone Calls – If you look at the Phone Calls graph, you can see the trends related to when people call you the most/interact with the phone number icon on your GMB post.
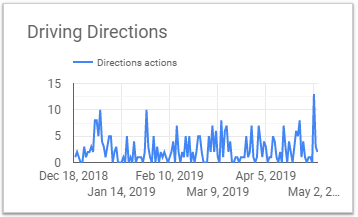
- Driving Directions – This graph is going to be similar to your Maps dashboard. It refers to how often people request directions to your business. Again, this is going to apply most heavily to local businesses.
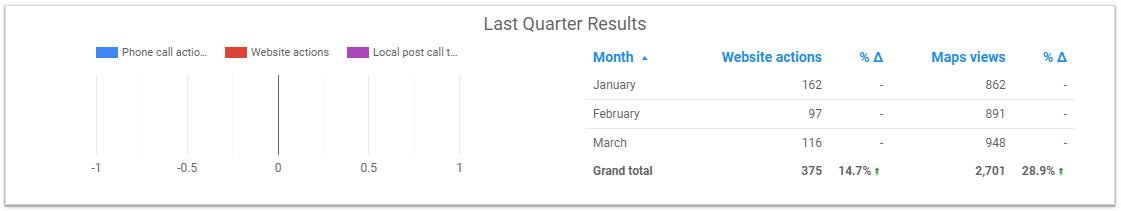
- Last Quarter Result – This dashboard sums everything up from the last quarter. It serves as an overview of all your website actions, map actions, phone actions, post actions, etc.
Final Thought
If you use GMB (which you definitely should!) consolidating all your data into a unified Google Data Studio dashboard is a must!
Google and the business world are becoming more co-dependent every day. Maximizing each data point in your GMB insights is crucial for positive and ongoing growth. Not only does this give you quick and accessible insight on how your business posting performs, but this information can also be a strong catalyst for future marketing tactics on Google. Neglecting to do this is perhaps the biggest, most overarching mistake businesses make.
Connecting your GMB data to Google Data Studio is super quick and easy! If you had any doubts or were intimidated by the process of unifying it all, hopefully, this post did its job in showing you the simplicity of getting the most out of your GMB insights!
Got questions about Google My Business or how our local SEO services will work for you? Please contact us to receive a quote or schedule a consultation.